IRS 2027 inflation adjustments tracker: what the CPI has decided
Every indexed 2027 tax number on one page: the statutory windows, the C-CPI-U math that reproduces 2026 exactly, and what the August CPI has now decided.
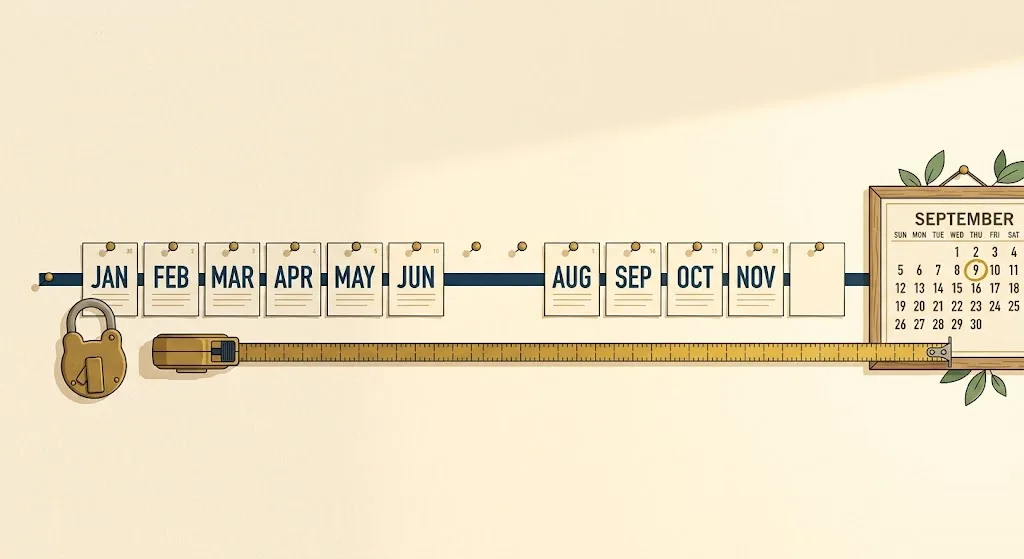
The Bureau of Labor Statistics published the August 2026 Consumer Price Index on Friday, September 11, at 8:30 a.m. Eastern. For most people it was one more inflation headline. For a specific list of 2027 tax numbers it was the closing bell: the law defines the inflation adjustment as an average of twelve monthly index values ending in August, and August was the twelfth. With that figure in the database, the 2027 tax brackets, the standard deduction, the health FSA cap, the annual gift exclusion, the estate exemption and the Medicare IRMAA thresholds are no longer forecasts. They are arithmetic waiting for the IRS and the Social Security Administration to type them up, which they will do sometime between mid-October and November.
The chained index came in at 185.739, up 0.31 percent from July and the first monthly rise since May. That single reading did what this page said it would do on September 6: it lifted most bracket thresholds one $50 step above the flat-August projection, pushed two IRMAA tiers over their rounding lines, and left the gift exclusion, the FSA cap and the single standard deduction exactly where they were already headed. One ambiguity survives the release, because one of the twelve months does not exist at all: the government was shut when it should have been measured, and nobody in Washington has said how the gap will be handled. This page tracks all of it, with the statute, the data, and a check that the method reproduces the 2026 figures the IRS actually published.
The statute picks the window, not the IRS
The core rule is in 26 U.S.C. §1(f). Paragraph (3) defines the cost-of-living adjustment as the percentage by which “the C-CPI-U for the preceding calendar year” exceeds the index for a base year, and paragraph (6) defines that measure precisely: “The C-CPI-U for any calendar year is the average of the C-CPI-U as of the close of the 12-month period ending on August 31 of such calendar year.” For tax year 2027 the preceding calendar year is 2026, so the window runs from September 2025 through August 2026. The index is the Chained Consumer Price Index for All Urban Consumers, BLS series SUUR0000SA0, which the Tax Cuts and Jobs Act substituted for the regular CPI-U in 2018 because it grows a little more slowly.
Each dollar amount then has its own base year and its own rounding rule, and the differences matter at the margin:
| Item | Statute | Base year substituted | Rounding |
|---|---|---|---|
| Bracket thresholds where the 22 % bracket and higher end | §1(j)(3)(B)(i) | 2017 | Down to $50 ($25 single and MFS) |
| Top of the 10 % and 12 % brackets | §1(j)(3)(B)(i), as amended by OBBBA | 2016 | Down to $50 ($25 single and MFS) |
| Standard deduction ($15,750 single, $23,625 HoH; joint is double the single figure) | §63(c)(7) | 2024 | Down to $50 |
| Health FSA salary-reduction cap ($2,500) | §125(i) | 2012 | Down to $50 |
| Annual gift exclusion ($10,000) | §2503(b)(2) | 1997 | Down to $1,000 |
| Estate and gift basic exclusion ($15,000,000) | §2010(c)(3)(B) | 2025 | Nearest $10,000 |
| Roth IRA and IRA deduction phase-out ranges | §408A(c)(3)(D), §219(g)(8) | 2005 | Nearest $1,000 |
| Medicare IRMAA thresholds ($85,000 / $107,000 / $133,500 / $160,000) | 42 U.S.C. §1395r(i)(5) | 12 months ending August 2018, regular CPI-U | Nearest $1,000 |
Two footnotes to that table. First, the One Big Beautiful Bill Act gave the 10 percent and 12 percent brackets an extra year of inflation by moving their base year back to 2016 while leaving the higher brackets on 2017; that is why the top of the 12 percent bracket grew faster than the rest in the 2026 tables. Second, for base years before 2017 the statute splices the old CPI-U series onto the chained one: §1(f)(3)(B) multiplies the base-year CPI by the ratio of the 2016 chained index to the 2016 regular index, which works out to 0.5698. That is how a 1997 base, a 2005 base and a 2012 base can be compared with a 2026 chained-index reading.
Equally important is what is not in this window. The 401(k) deferral limit and the IRA contribution limit use the third-quarter average of the regular CPI-U under §415(d), so they wait for the September print in mid-October; our 2027 401(k) and IRA projection carries that threshold, 334.67, which after the August print comes down to a single question about September. The Social Security COLA uses the third-quarter CPI-W, tracked on the 2027 COLA page, and the figures the SSA indexes to wages rather than prices, from the quarter of coverage to the earnings test, have their own 2027 Social Security figures tracker. The 2027 HSA limits were published by the IRS in May, because §223(g) uses a twelve-month period ending in March. This page covers the September-to-August family only, and one member of that family that is easy to miss: the Roth IRA and IRA deduction phase-out ranges share the window and the base-year splice, so the August print settled them too. They have their own page, the 2027 Roth IRA and IRA deduction phase-outs, which runs the same check against the 2026 figures.
Checking the method against the 2026 numbers
A projection method is worth exactly as much as its ability to reproduce a number that is already public. Rev. Proc. 2025-32, released October 9, 2025, set the 2026 figures. Running the statute on the September 2024 to August 2025 window reproduces every one of them, with one instructive wrinkle.
The chained-index values BLS publishes today for that window average 177.206. Using that figure, the 2026 bracket thresholds come out one $50 step too high in most cases. Using 177.11 instead, every threshold in the revenue procedure appears exactly, across all three filing-status tables:
| 2026, married filing jointly | Rev. Proc. 2025-32 | Method, window average 177.11 |
|---|---|---|
| 10 % bracket ends | $24,800 | $24,800 |
| 12 % bracket ends | $100,800 | $100,800 |
| 22 % bracket ends | $211,400 | $211,400 |
| 24 % bracket ends | $403,550 | $403,550 |
| 32 % bracket ends | $512,450 | $512,450 |
| 35 % bracket ends | $768,700 | $768,700 |
| Standard deduction (single / joint / HoH) | $16,100 / $32,200 / $24,150 | $16,100 / $32,200 / $24,150 |
| Health FSA cap | $3,400 | $3,400 |
| Annual gift exclusion | $19,000 | $19,000 |
The reason for the wrinkle is that BLS revises the chained index for roughly a year after first publication, and the IRS evidently uses whatever values are in hand when it writes the revenue procedure in September. The values it used in September 2025 were about 0.05 percent lower than the revised ones the database shows now. The lesson for 2027 is that the IRS will use the “initial” and “interim” values BLS published through September 11, not the finals that will replace them next February, and those are the values this page uses. The single-filer table, with its $25 rounding, and the head-of-household table reproduce the same way.
The IRMAA check is cleaner because the regular CPI-U is not revised. The twelve months ending August 2025 average 319.205, the August 2018 base window averages 249.280, and applying that ratio to $85,000, $107,000, $133,500 and $160,000 and rounding to the nearest $1,000 gives $109,000, $137,000, $171,000 and $205,000, which are exactly the 2026 thresholds CMS announced on November 19, 2025.
The data: twelve months, eleven values
Here is the closed 2027 window, from the BLS public API, series SUUR0000SA0 for the chained index and CUUR0000SA0 for the regular one:
| Month | C-CPI-U | CPI-U (NSA) |
|---|---|---|
| September 2025 | 180.373 | 324.800 |
| October 2025 | not published | not published |
| November 2025 | 179.889 | 324.122 |
| December 2025 | 179.775 | 324.054 |
| January 2026 | 180.409 | 325.252 |
| February 2026 | 181.258 | 326.785 |
| March 2026 | 183.193 | 330.213 |
| April 2026 | 184.680 | 333.020 |
| May 2026 | 185.771 | 335.123 |
| June 2026 | 185.172 | 333.952 |
| July 2026 | 185.162 | 333.918 |
| August 2026 | 185.739 | 334.980 |
| Eleven-month average | 182.8565 | 329.6563 |
The eleven published chained values average 182.8565, which is 1.3446 times the 2016 base window (135.993) and 1.3228 times the 2017 base window (138.237). Those two factors, applied to the dollar amounts written into §1(j)(2) in 2017, produce the 2027 brackets. The window runs 3.24 percent above the 177.11 that set the 2026 numbers, noticeably more than the 2.4 percent that separated 2026 from 2025.
Notice how little and how much August did. Because it was one of eleven months, a rise of 0.31 percent moved the window average by only 0.03 percent, from the 182.804 a flat month would have produced to 182.857. But so many thresholds were sitting within a single rounding step of the line that 0.03 percent was enough: four of the six joint bracket tops moved up one step from the projection this page carried a week ago, the second and third IRMAA tiers crossed to the next $1,000, and the estate exemption gained $20,000. What August could not do, and did not, was move the gift exclusion, the FSA cap or the single standard deduction, each of which needed a monthly swing several times larger.
The month that never happened
The government shutdown of October and November 2025 stopped price collection between October 1 and November 12. BLS resumed with the November index and has said it will not publish an October 2025 CPI. The public data series simply skips from September to November, for the chained index and the regular one alike.
The statute, though, says “the average of the C-CPI-U as of the close of the 12-month period ending on August 31.” It does not say what to do when one of the twelve is missing, and neither the IRS nor the Social Security Administration has issued guidance. The Treasury faced the same problem first, for inflation-protected securities, and on November 26, 2025 it invoked the index-contingency clause in its offering circular and announced an October 2025 figure of 325.604 for the regular CPI-U, adding that it “will not replace this index number even if BLS subsequently reports actual CPI for October 2025.” That number binds Treasury’s bond payments. It does not bind the IRS.
Two readings are defensible. One is to average the eleven months that exist. The other is to fill the gap with an estimate, as Treasury did; for the chained index the natural estimate is the midpoint of September and November, 180.131. Because October 2025 sat well below the spring and summer readings, including it pulls the average down, from 182.8565 to 182.6293, and the regular CPI-U window from 329.656 to 329.319. That is a difference of 0.12 percent, and here is what 0.12 percent does on the closed window:
| 2027 figure | Eleven-month average | October imputed |
|---|---|---|
| Top of 37 % bracket, joint | $793,650 | $792,650 |
| Top of 12 % bracket, joint | $104,050 | $103,900 |
| Top of 10 % bracket, joint | $25,600 | $25,550 |
| Head-of-household standard deduction | $24,950 | $24,900 |
| Estate exemption | $15,490,000 | $15,470,000 |
| Second IRMAA tier, single | $142,000 | $141,000 |
| Third IRMAA tier, single | $177,000 | $176,000 |
| Fourth IRMAA tier, single | $212,000 | $211,000 |
| Roth IRA phase-out starts, joint | $250,000 | $249,000 |
| Gift exclusion, FSA cap, single standard deduction, first IRMAA tier | unchanged | unchanged |
The gap is not large in dollar terms, but it is systematic: every bracket threshold moves down by one step under the imputed reading, and the highest thresholds move by several. When the revenue procedure arrives, the first thing worth checking is which of these two columns it matches, because that will tell you how the IRS read the statute and will settle the same question for the estate exemption, the IRMAA tiers and the joint Roth range.
What August settled
With the window closed, the test for each figure is no longer what the next month might do but simply which side of a rounding line the final average landed on, and by how much.
The annual gift exclusion goes to $20,000. The unrounded 2027 figure is $20,119, against a rounding floor of $20,000; the imputed reading gives $20,094. The 2026 figure had been stuck at $19,000 because the unrounded amount was about $19,490, just short of the line, and rounding down erased almost $500 of accumulated inflation. That backlog is what makes 2027 the year it finally clears, and no treatment of October can undo it. For married couples using gift splitting, $40,000 per recipient; our Form 709 gift-splitting guide covers the filing side.
The health FSA cap goes to $3,500, and the carryover to $700. Unrounded, $3,516; floor, $3,500. The $3,550 step would have needed a window average above 184.6, which was never within reach. The carryover maximum is 20 percent of the cap under Notice 2020-33, so $700. Employers finalizing 2027 open-enrollment materials can use $3,500 with the “pending IRS confirmation” label doing very little work. The FSA limit page has the plan-year details.
The standard deduction: $16,600 single, $33,200 joint, and a head-of-household figure that depends on October. The 2024 base is 173.016, so the factor is 1.0569 and the unrounded single amount is $16,646, about $4 short of the $16,650 step. Moving up would have required an August chained index of 186.245; it printed 185.739. The joint figure is fixed by statute at twice the single one. The head-of-household number is $24,950 on the eleven-month average (unrounded $24,969) and $24,900 with October imputed (unrounded $24,938), so it is the one standard-deduction figure that waits for the revenue procedure.
The IRMAA tiers, and thirty-one cents. The regular CPI-U window averages 329.656, the factor over the 2018 base is 1.32243, and the four indexed thresholds come out at $112,407, $141,500, $176,545 and $211,589 before rounding, which is $112,000, $142,000, $177,000 and $212,000 after it. The second tier deserves a closer look: $107,000 times the factor is $141,500.31. It rounds up to $142,000 by thirty-one cents on a threshold of a hundred and forty-two thousand dollars. Had the August CPI-U printed 334.97 instead of 334.98, the tier would have stayed at $141,000. Under the October-imputed reading it does stay there, at $141,355 unrounded, and the third and fourth tiers drop to $176,000 and $211,000 as well. The first tier, $112,000 single and $224,000 joint, is safe under either reading and is the one that matters to the most people, since it is where the surcharge begins. The $500,000 single and $750,000 joint tier is not indexed at all until 2028. Our IRMAA projection page puts the surcharge amounts against these thresholds and flags the second tier as the number to check when CMS publishes in November.
Every bracket threshold. On the eleven-month average the joint table reads $25,600, $104,050, $218,250, $416,650, $529,100 and $793,650 for the tops of the 10 through 35 percent brackets; the single-filer table reads $12,800, $52,025, $109,125, $208,325, $264,550 and $661,375. Compared with the flat-August projection published here on September 6, the 12, 22, 24, 32 and 35 percent joint thresholds each moved up one or more $50 steps and the 10 percent threshold held at $25,600. The brackets and standard deduction page carries all three filing-status tables with both October readings side by side.
The estate exemption. $15,000,000 times the ratio of the 2026 window to the 2025 window, rounded to the nearest $10,000. Two things remain unsettled rather than three: the October treatment, and whether the IRS divides by the 2025 average it used last year (177.11) or the revised figure BLS shows now (177.206). Eleven months over 177.11 gives $15,486,685, or $15,490,000; over 177.206, $15,478,310, or $15,480,000. The imputed window gives $15,470,000 and $15,460,000 on the same two divisors. It is a $30,000 range on a $15 million number, which is to say it does not change anyone’s planning; the estate and gift page explains why the sunset that would have mattered never came.
The 2027 tables as they stand
Central case throughout: the eleven published months averaged, October omitted. Official figures are marked; everything else is the statute applied to a closed window, awaiting the agency’s document.
| Item | 2026 (official) | 2027 (this page) | Status |
|---|---|---|---|
| Standard deduction, single and MFS | $16,100 | $16,600 | Decided |
| Standard deduction, joint | $32,200 | $33,200 | Decided |
| Standard deduction, head of household | $24,150 | $24,950 ($24,900 if October imputed) | October-dependent |
| Health FSA cap / carryover | $3,400 / $680 | $3,500 / $700 | Decided |
| Annual gift exclusion | $19,000 | $20,000 | Decided |
| Estate and gift exemption | $15,000,000 | $15,490,000 ($15.46 to $15.49 million) | October- and divisor-dependent |
| IRMAA tier 1, single / joint | $109,000 / $218,000 | $112,000 / $224,000 | Decided |
| IRMAA tier 2, single / joint | $137,000 / $274,000 | $142,000 / $284,000 ($141,000 / $282,000 if October imputed) | October-dependent, on the line |
| IRMAA tier 3, single / joint | $171,000 / $342,000 | $177,000 / $354,000 ($176,000 / $352,000 if October imputed) | October-dependent |
| IRMAA tier 4, single / joint | $205,000 / $410,000 | $212,000 / $424,000 ($211,000 / $422,000 if October imputed) | October-dependent |
| IRMAA top tier, single / joint | $500,000 / $750,000 | $500,000 / $750,000 | Fixed by statute |
| Roth IRA phase-out, single | $153,000 to $168,000 | $158,000 to $173,000 | Decided |
| Roth IRA phase-out, joint | $242,000 to $252,000 | $250,000 to $260,000 ($249,000 to $259,000 if October imputed) | October-dependent |
| HSA, self-only / family | $4,400 / $8,750 | $4,500 / $9,000 | Official (Rev. Proc. 2026-24) |
| 401(k) deferral | $24,500 | $25,000 or $25,500; September CPI-U of 335.11 or more for $25,500 | Different window, mid-October |
| Social Security COLA | 2.8 % | 3.2 to 3.5 %, center 3.4 % | Different window, mid-October |
The joint bracket tops, against the 2026 official table:
| Bracket ends | 2026 (official) | 2027, eleven-month average | 2027, October imputed |
|---|---|---|---|
| 10 % | $24,800 | $25,600 | $25,550 |
| 12 % | $100,800 | $104,050 | $103,900 |
| 22 % | $211,400 | $218,250 | $217,950 |
| 24 % | $403,550 | $416,650 | $416,150 |
| 32 % | $512,450 | $529,100 | $528,450 |
| 35 % | $768,700 | $793,650 | $792,650 |
And the single-filer tops, where the statute rounds to $25 rather than $50:
| Bracket ends | 2027, eleven-month average | 2027, October imputed |
|---|---|---|
| 10 % | $12,800 | $12,775 |
| 12 % | $52,025 | $51,950 |
| 22 % | $109,125 | $108,975 |
| 24 % | $208,325 | $208,075 |
| 32 % | $264,550 | $264,225 |
| 35 % | $661,375 | $660,550 |
The calendar from here
- Friday, September 11, 8:30 a.m. ET. August CPI, published. The twelve-month window closed for everything in the tables above; this page was updated with the final averages and each item marked as decided or October-dependent.
- Mid-October. September CPI. Closes the third-quarter windows: the COLA, the 401(k) and IRA contribution limits, and the November I bond rate. The SSA announces the COLA, the wage base and the wage-indexed figures within hours.
- Mid-October to November. The IRS revenue procedure with the 2027 brackets, standard deduction, FSA cap, gift exclusion and estate exemption. In 2025 it came on October 9. The first check: which October column it matches.
- November. The IRS notice on retirement plan limits, including the Roth and IRA phase-out ranges (November 13 in 2025), and the CMS announcement of 2027 Part B premiums and IRMAA thresholds (November 19 in 2025). The second IRMAA tier is the line to read first.
A closing note on what this page is for. Sites that publish “2027 tax brackets” in June are guessing at an inflation rate and multiplying; the numbers here are the statute applied to the published index, checked against the last revenue procedure, with the one genuine ambiguity, October 2025, shown both ways rather than hidden inside a single figure. When the official documents land they should match one of the two columns above to the dollar. If they do not, the discrepancy is the story, and it will be explained here.
Published September 6, 2026. Updated September 13, 2026, with the August 2026 index that closed the window. Next update: the day the IRS revenue procedure is released.
Quick answers
When will the IRS publish the official 2027 tax brackets?
The IRS publishes the next year's inflation adjustments in a revenue procedure once the August CPI is out. For 2026 that document was Rev. Proc. 2025-32, released on October 9, 2025. The 2027 figures should arrive between mid-October and November 2026. The arithmetic behind them was fixed by statute on September 11, 2026, when the Bureau of Labor Statistics published the August index, because August is the twelfth and final month of the averaging window in 26 U.S.C. 1(f)(6). What remains is how the IRS treats the one month in that window that was never published.
Is the annual gift tax exclusion going to $20,000 in 2027?
Yes. The exclusion is $10,000 indexed from a 1997 base and rounded down to the next $1,000. With the twelve-month window now closed, the unrounded 2027 figure is about $20,119, comfortably past the $20,000 line under either treatment of the missing October 2025 month. It had been stuck at $19,000 for 2025 and 2026 because the unrounded amount fell just short of $20,000. The IRS will confirm the number in its fall revenue procedure; the arithmetic no longer has any room to move.
What will the 2027 standard deduction be?
On the closed window, $16,600 for single filers and married filing separately, $33,200 for joint filers, and $24,950 for heads of household, with the head-of-household figure $24,900 if the IRS fills the unpublished October 2025 month with an estimate rather than averaging the eleven months that exist. The single figure came out about $4 short of the $16,650 step: the unrounded amount is $16,646. These are projections until the IRS revenue procedure confirms them, but the index that drives them is final.
Why does the missing October 2025 CPI matter for 2027 taxes?
The law defines the inflation measure as the average of twelve monthly index values ending in August. The Bureau of Labor Statistics did not collect price data during the October 2025 government shutdown and has said it will not publish an October 2025 index. Averaging the eleven months that exist gives a slightly higher number than filling the gap with an estimate, because October sat below the later months. That difference is worth $50 to $1,000 on individual bracket thresholds, $50 on the head-of-household standard deduction, and $1,000 on three of the four indexed IRMAA tiers. Neither the IRS nor the Social Security Administration has said which approach it will use.
Does this tracker cover the 2027 401(k) and IRA limits?
Only by reference. The 401(k) and IRA contribution limits run on a different clock, the third-quarter average of the CPI-U under 26 U.S.C. 415(d), so they are not settled until the September CPI arrives in mid-October. The same is true of the Social Security COLA, which uses the CPI-W for the third quarter, and the wage base, which uses the national average wage index rather than prices at all. Each has its own page on this site with its own thresholds; this tracker covers the numbers that share the twelve-months-ending-August window.
Does the August CPI also settle the 2027 Roth IRA income limits?
Yes, by the same mechanism. The Roth IRA and traditional IRA deduction phase-out ranges are indexed under 26 U.S.C. 408A(c)(3)(D) and 219(g)(8) using the cost-of-living adjustment of section 1(f)(3), the same twelve-months-ending-August chained index this page tracks, with a 2005 base and rounding to the nearest $1,000. On the closed window the single Roth range moves to $158,000 to $173,000 and the joint range to $250,000 to $260,000, or $249,000 to $259,000 if October 2025 is imputed. The full arithmetic, including the check against the 2026 figures, is on our 2027 Roth IRA and IRA deduction phase-outs page.
Educational content only. finbarrow is an independent editorial publication, not a licensed financial advisor, broker, tax preparer, or attorney. Verify rates and terms with the issuer or relevant regulator. See disclaimers and funding disclosures.